Segment Information
These tables and graphs show business and geographic segment information for the previous years.
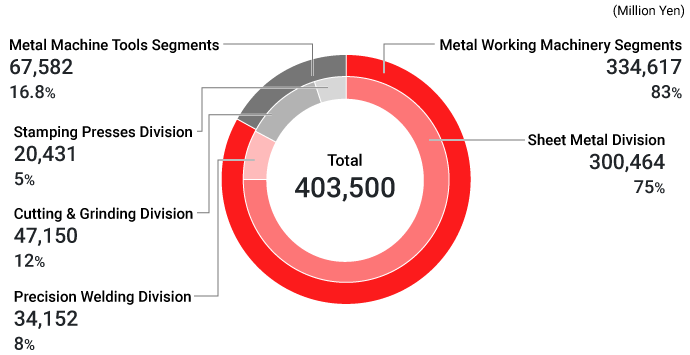
Operating Segments
Sales by Business Segments in FY ended March 2025 (Million Yen)
Total : 396,670
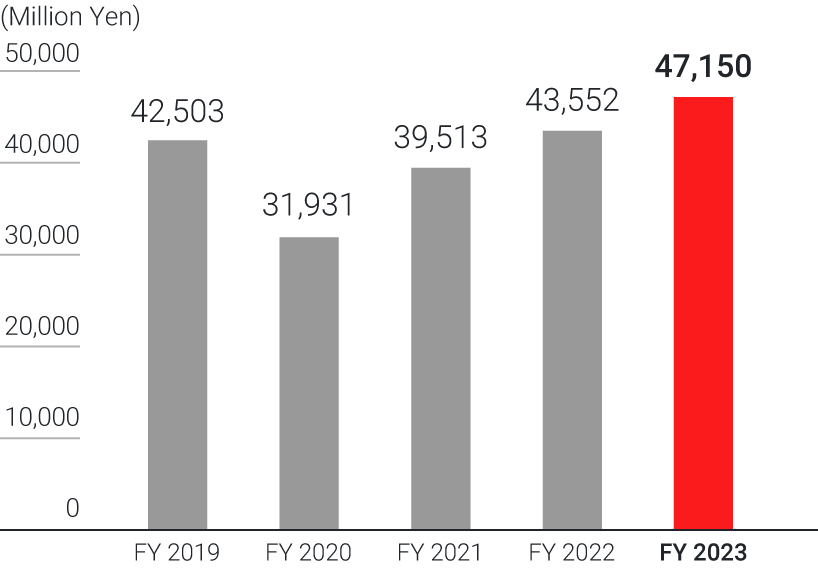
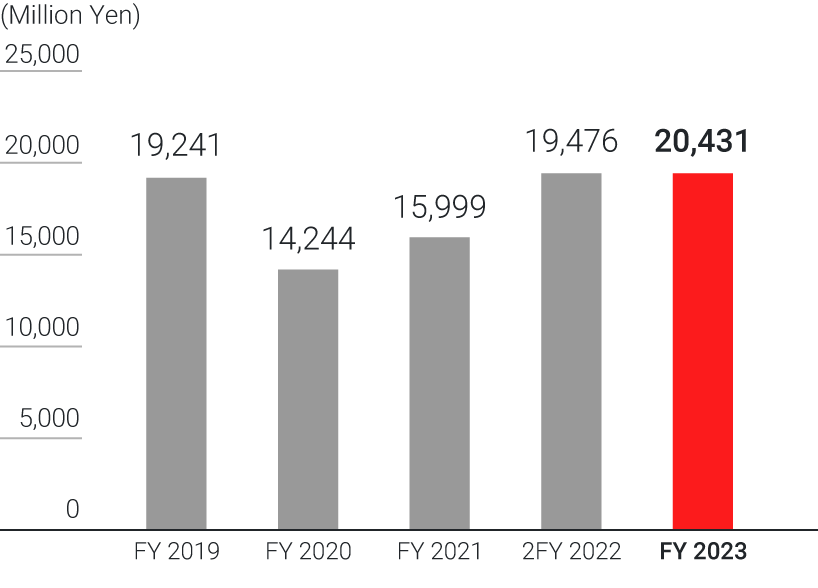
5 Years Highlights (Million Yen)
[Sales]
| FY 2020 | FY 2021 | FY 2022 | FY 2023 | FY 2024 | |
|---|---|---|---|---|---|
| Metal Working Machinery Segments | 203,087 | 255,892 | 301,371 | 334,617 | 330,201 |
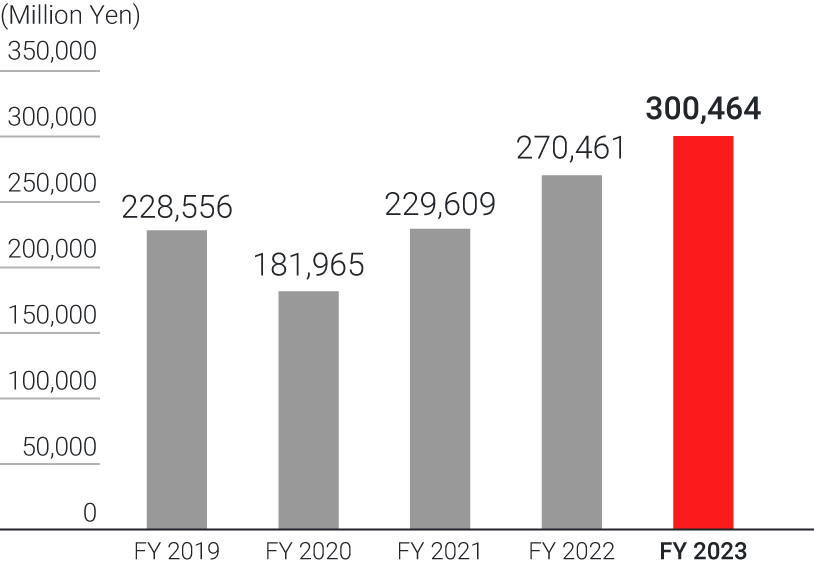
| Sheet Metal Division | 181,965 | 229,609 | 270,461 | 300,464 | 298,241 |
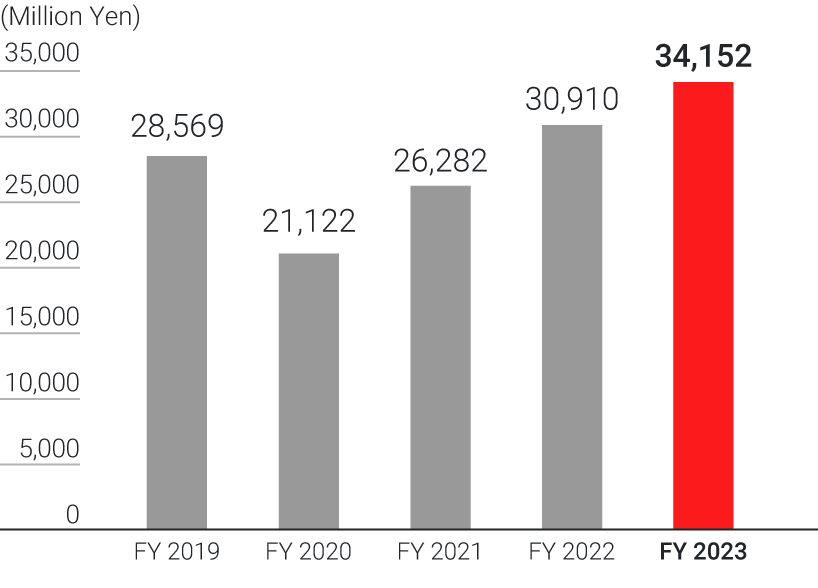
| Precision Welding Division | 21,122 | 26,282 | 30,910 | 34,152 | 31,959 |
| Metal Machine Tools Segments | 46,176 | 55,513 | 63,028 | 67,582 | 65,213 |
| Cutting & Grinding Division | 31,931 | 39,513 | 43,552 | 47,150 | 45,742 |
| Stamping Presses Division | 14,244 | 15,999 | 19,476 | 20,431 | 19,471 |
[Operating Profit]
| FY 2020 | FY 2021 | FY 2022 | FY 2023 | FY 2024 | |
|---|---|---|---|---|---|
| Metal Working Machinery Segments | 21,440 | 31,176 | 41,513 | 48,430 | 40,396 |
| OPM (%) | 10.6 | 12.2 | 13.8 | 14.5 | 12.2 |
| Metal Machine Tools Segments | 3,608 | 6,676 | 7,632 | 7,353 | 6,899 |
| OPM (%) | 7.8 | 12.0 | 12.1 | 10.9 | 10.6 |
* We have issued consolidated financial statements in accordance with IFRS from FY2018.
Sheet Metal Division
Precision Welding Division
Cutting & Grinding Division
Stamping Press Division
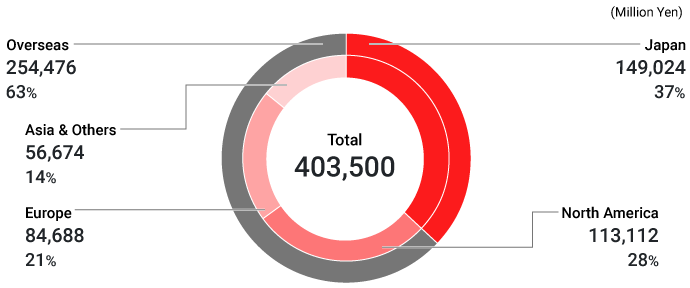
Regional Information
Sales by Region in FY ended March 2025
Total : 396,670
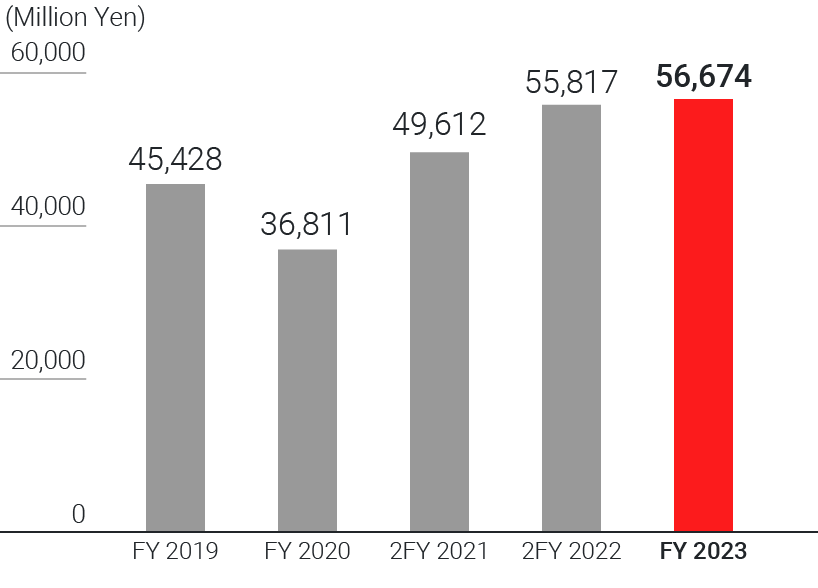
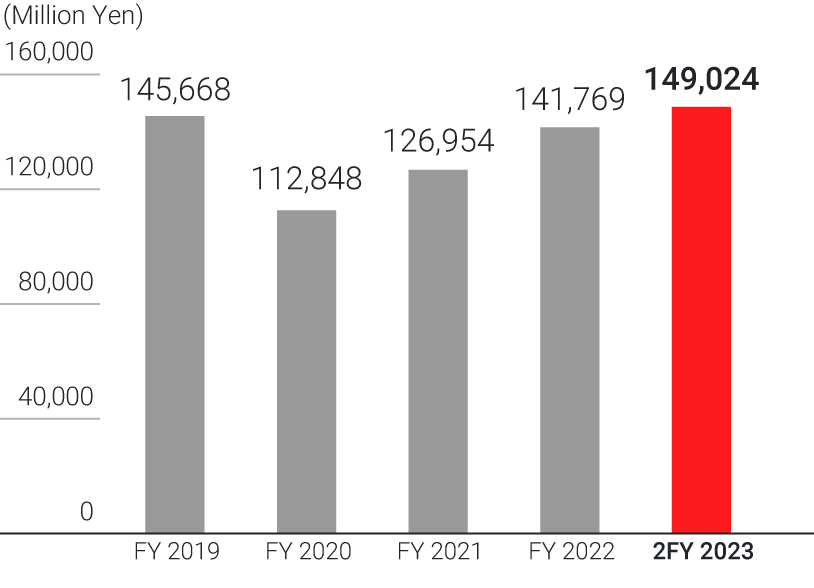
5 Years Highlights (Million Yen)
[Sales]
| FY 2020 | FY 2021 | FY 2022 | FY 2023 | FY 2024 | |
|---|---|---|---|---|---|
| Japan | 112,848 | 126,954 | 141,769 | 149,024 | 144,313 |
| Overseas | 137,599 | 185,704 | 223,918 | 254,476 | 252,357 |
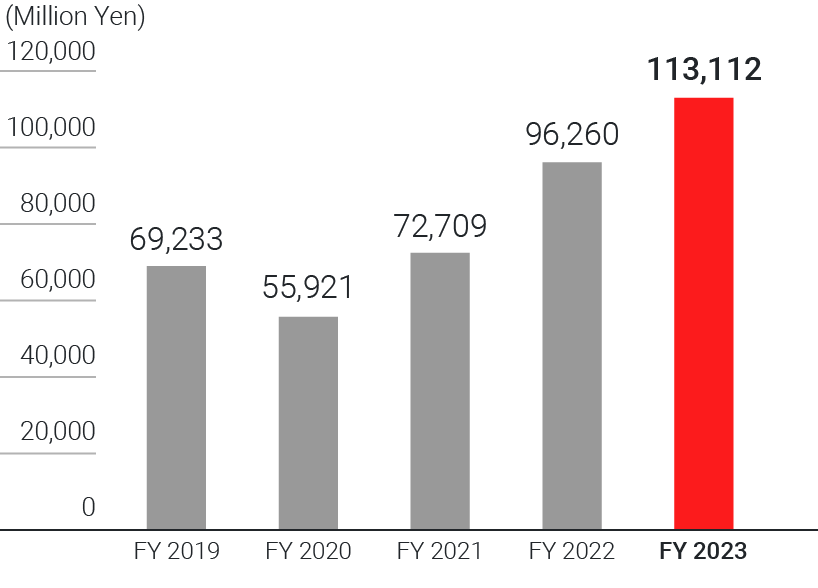
| North America | 55,921 | 72,709 | 96,260 | 113,112 | 113,559 |
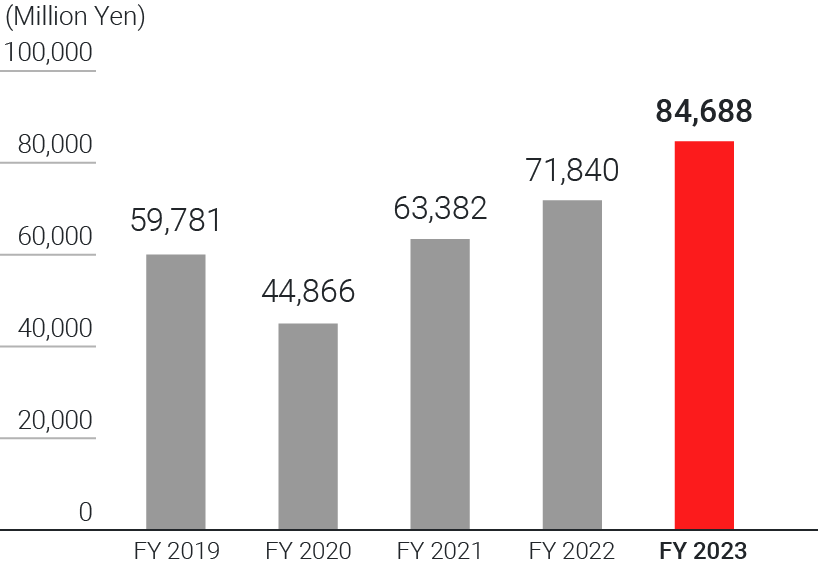
| Europe | 44,866 | 63,382 | 71,840 | 84,688 | 83,609 |
| Asia & Others | 36,811 | 49,612 | 55,817 | 56,674 | 55,188 |
* We have issued consolidated financial statements in accordance with IFRS from FY2018.
Japan
North America
Europe
Asia & Others